China E-Commerce Industry Analysis: Q1 CY2026 Earnings Teardown
Capital Reinvestment Competition Heating Up

Date: May 28, 2026
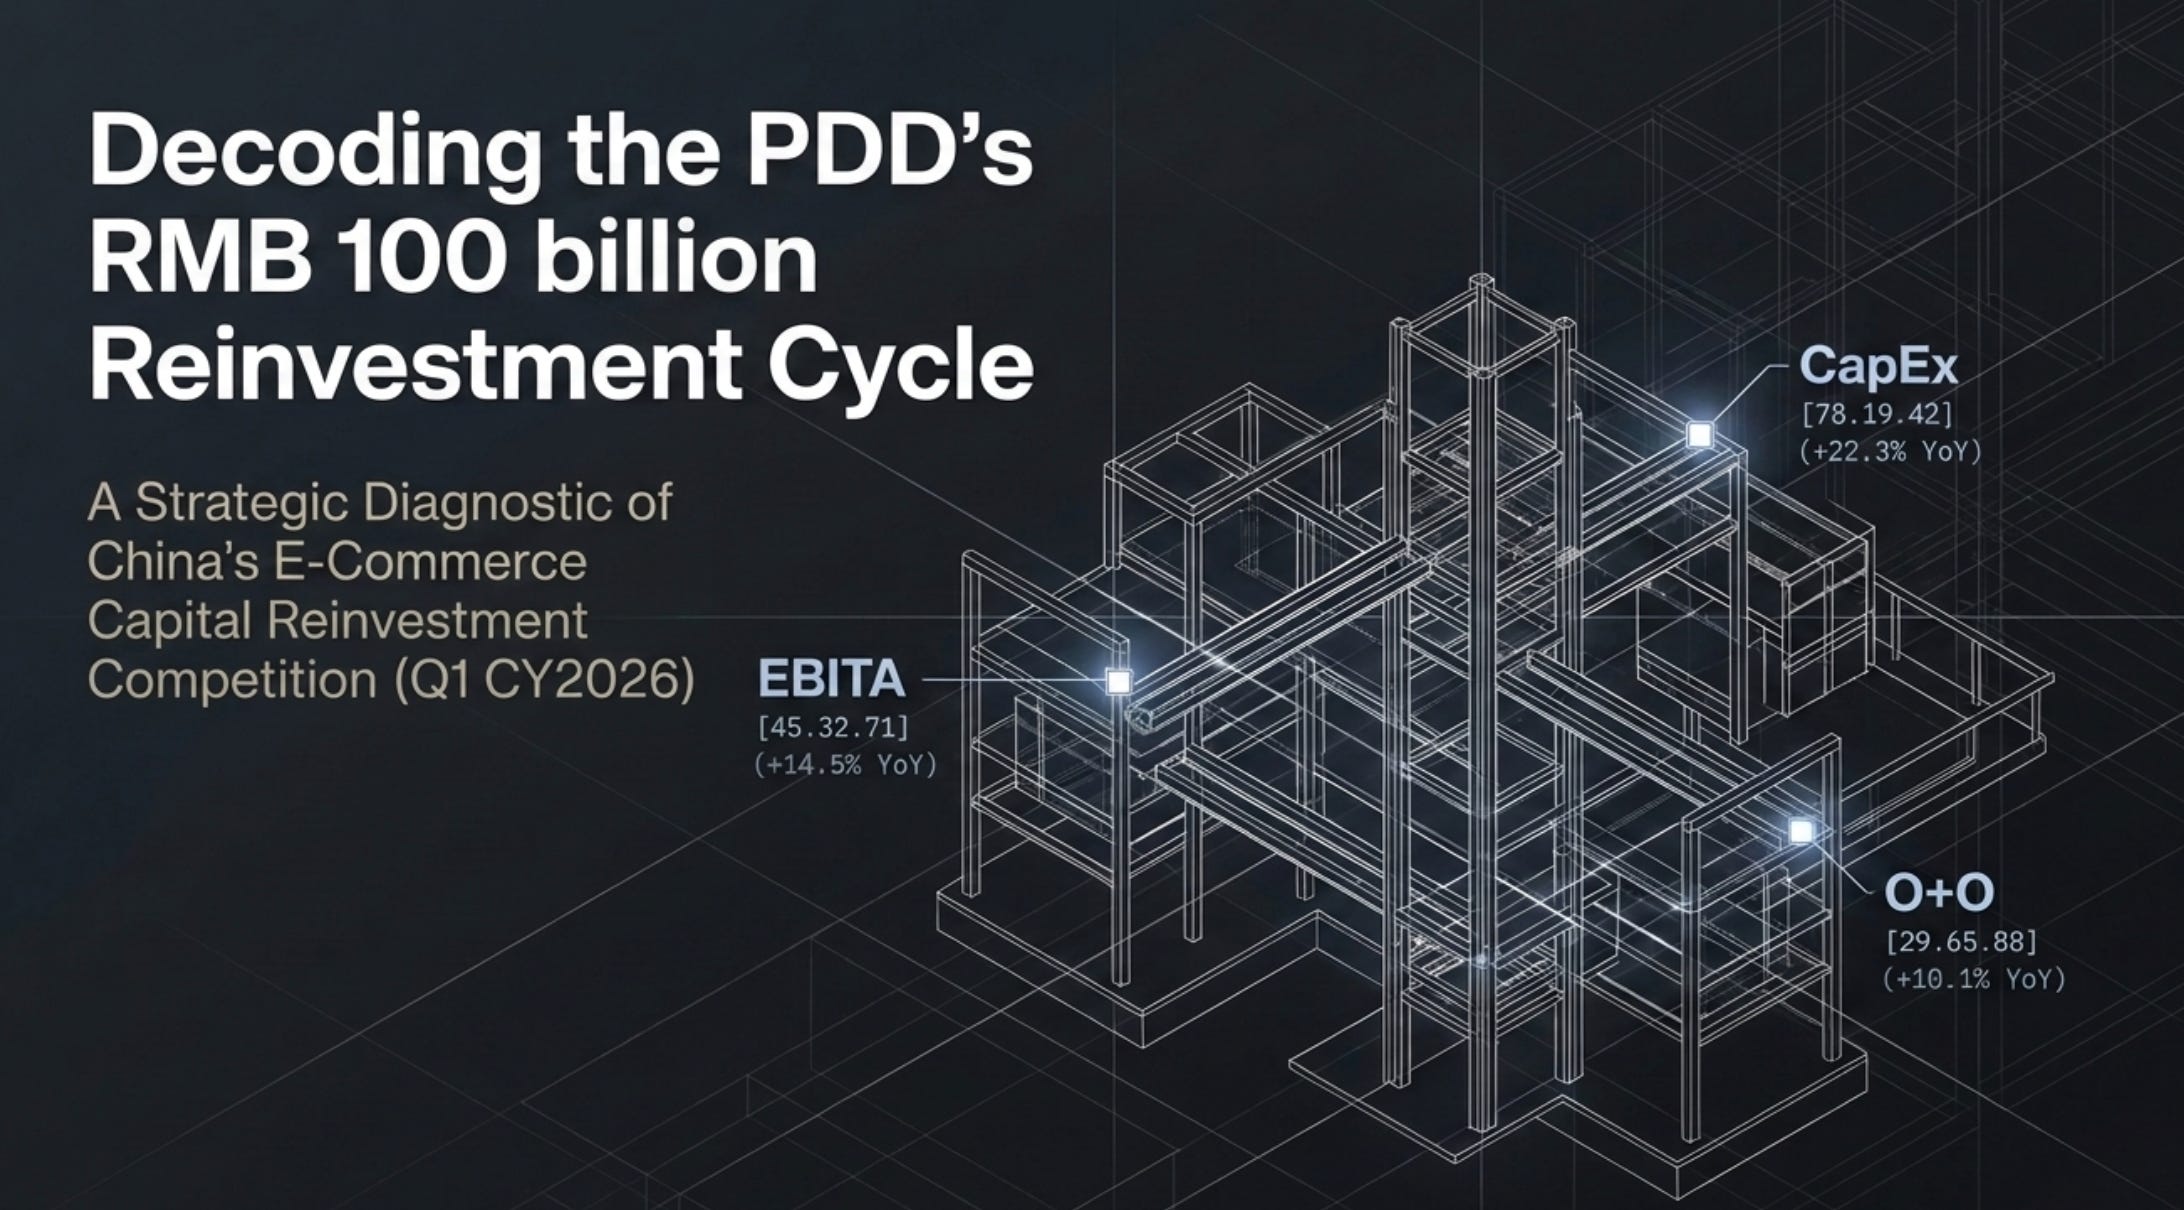
The Quick Commerce Evolution & The RMB 100 Billion Reinvestment Cycle
The first quarter of CY2026 marks a structural inflection point for the Chinese e-commerce ecosystem. The landscape has officially transitioned from a pure marketplace volume game into a multi-front war characterized by “The Everything Delivered Now Arena” (Quick Commerce), full online-to-offline infrastructure integration, and margin-dilutive tech/supply-chain reinvestments. Below is an institutional-grade diagnostic of the financial and strategic performance of Alibaba, JD.com, and PDD Holdings.
1. Summary Financial Performance Comparison
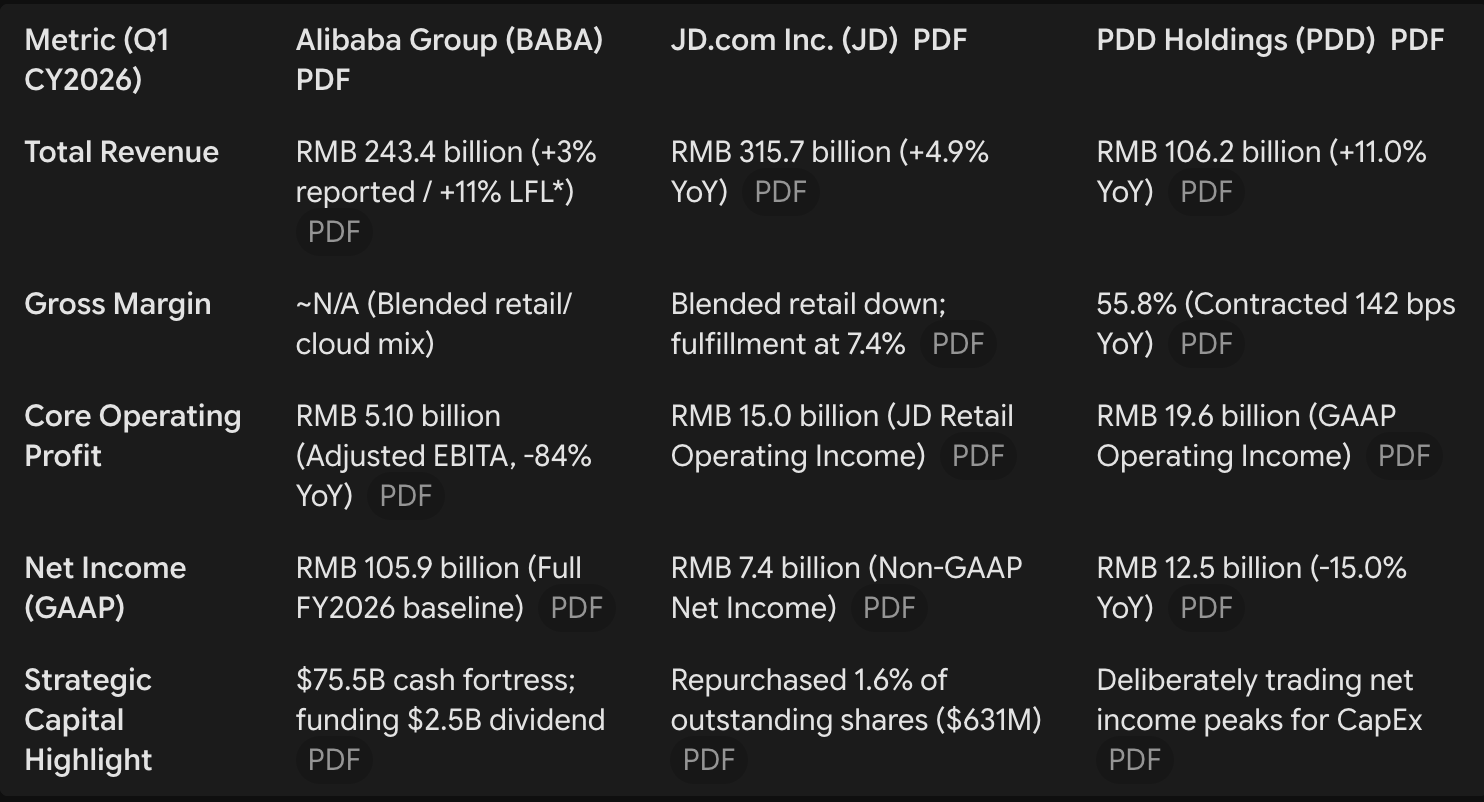
The financial print across the three tech giants reveals stark differences in capital allocation, growth profiles, and underlying margin dynamics:
*LFL: Like-for-Like growth removes the drag from the physical asset disposals of Sun Art and Intime.
Key Takeaways:
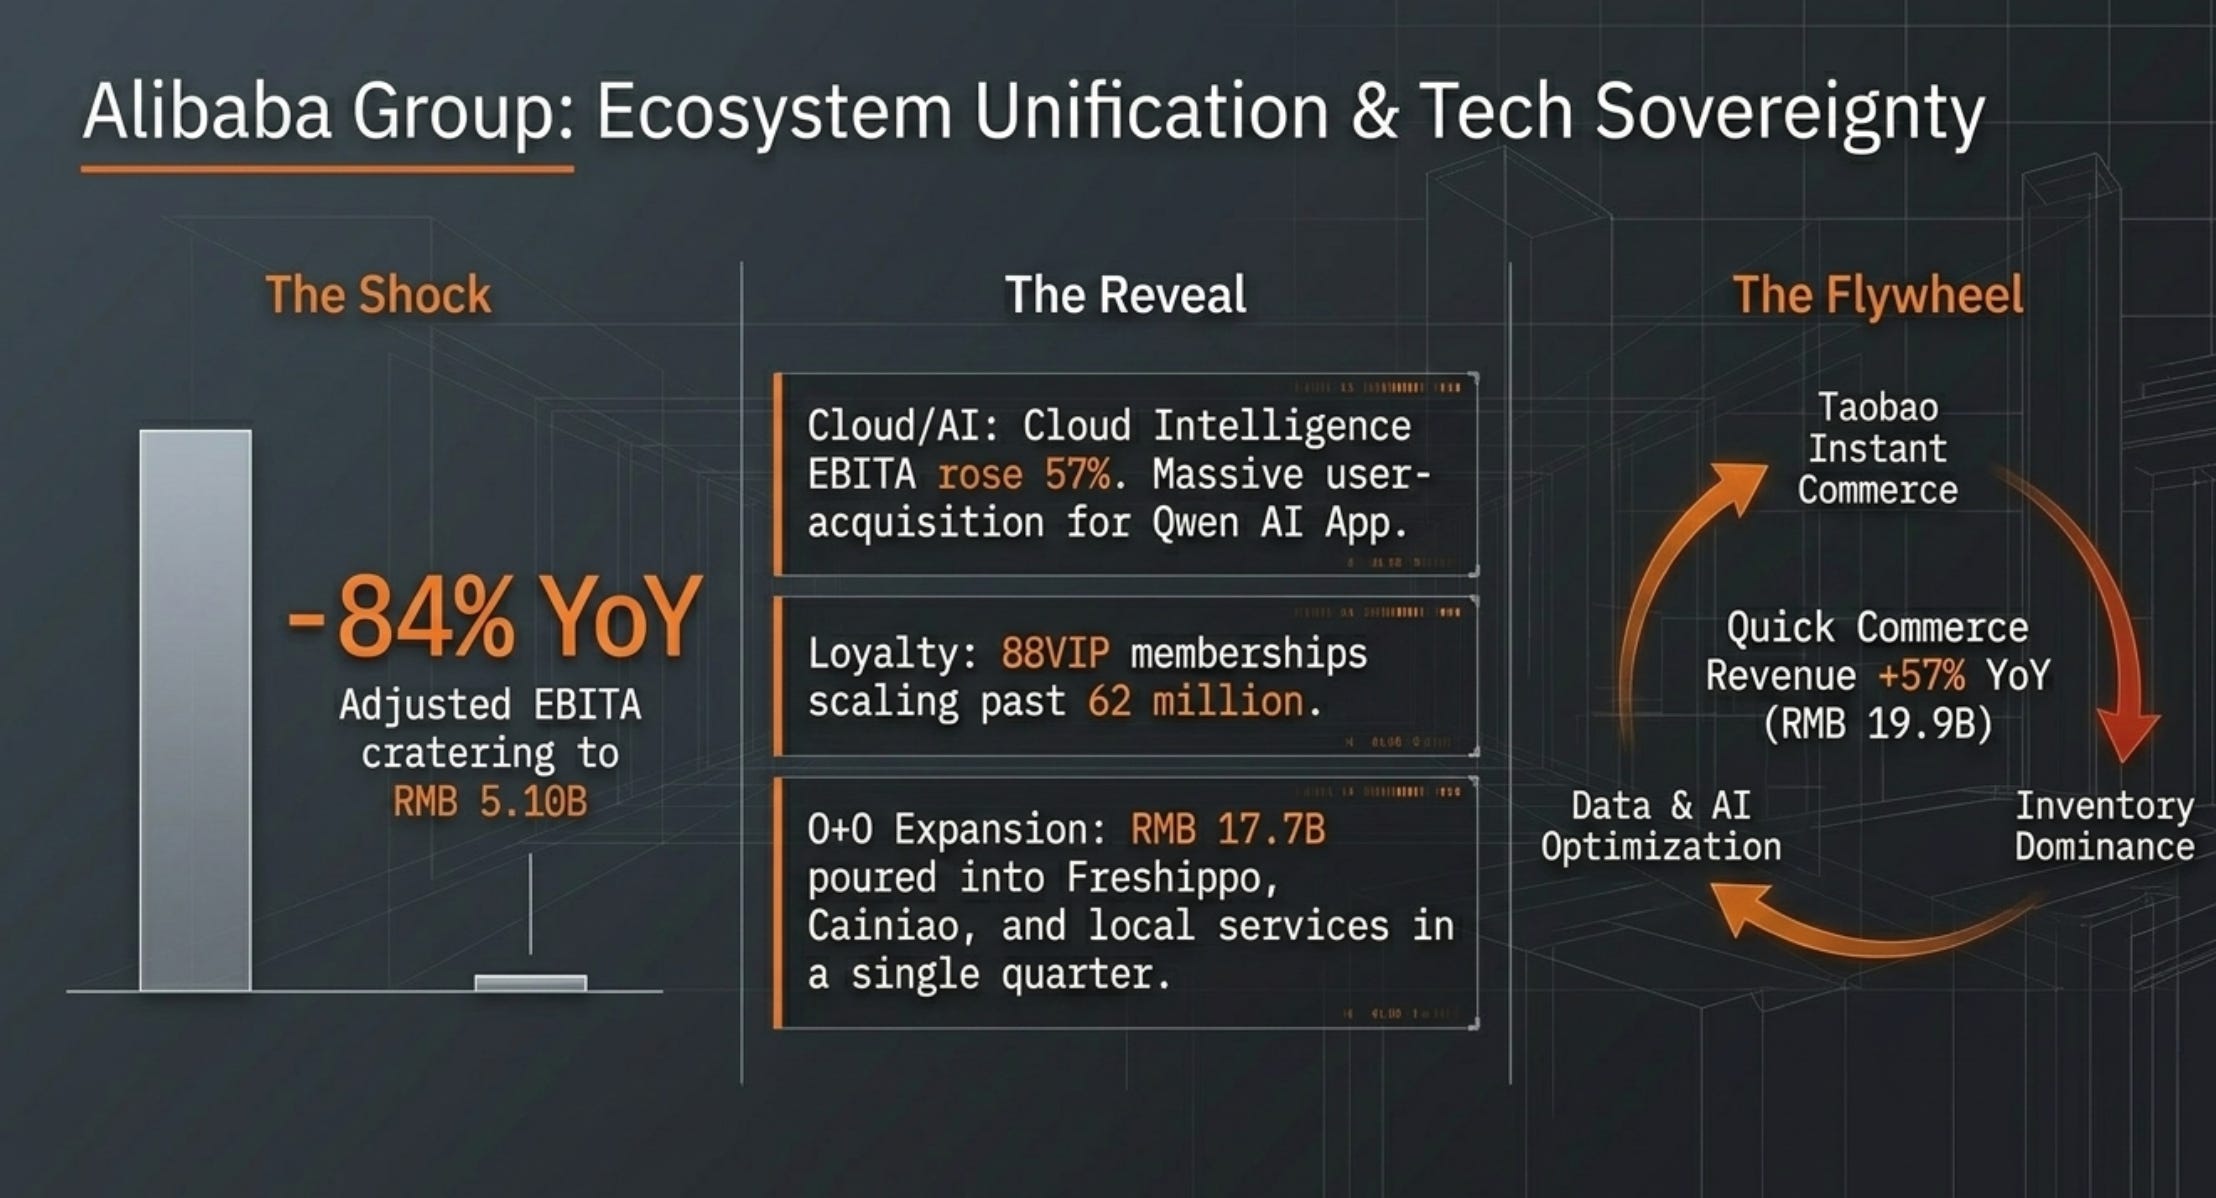
Alibaba’s Deliberate Bottom-line Squeeze: Alibaba’s reported net revenue growth of 3% masks an excellent 11% like-for-like adjustment. However, its Adjusted EBITA cratered 84% to RMB 5.10 billion. This was a calculated capital allocation strategy, sinking billions into cloud/AI infrastructure and aggressive Quick Commerce customer acquisition.
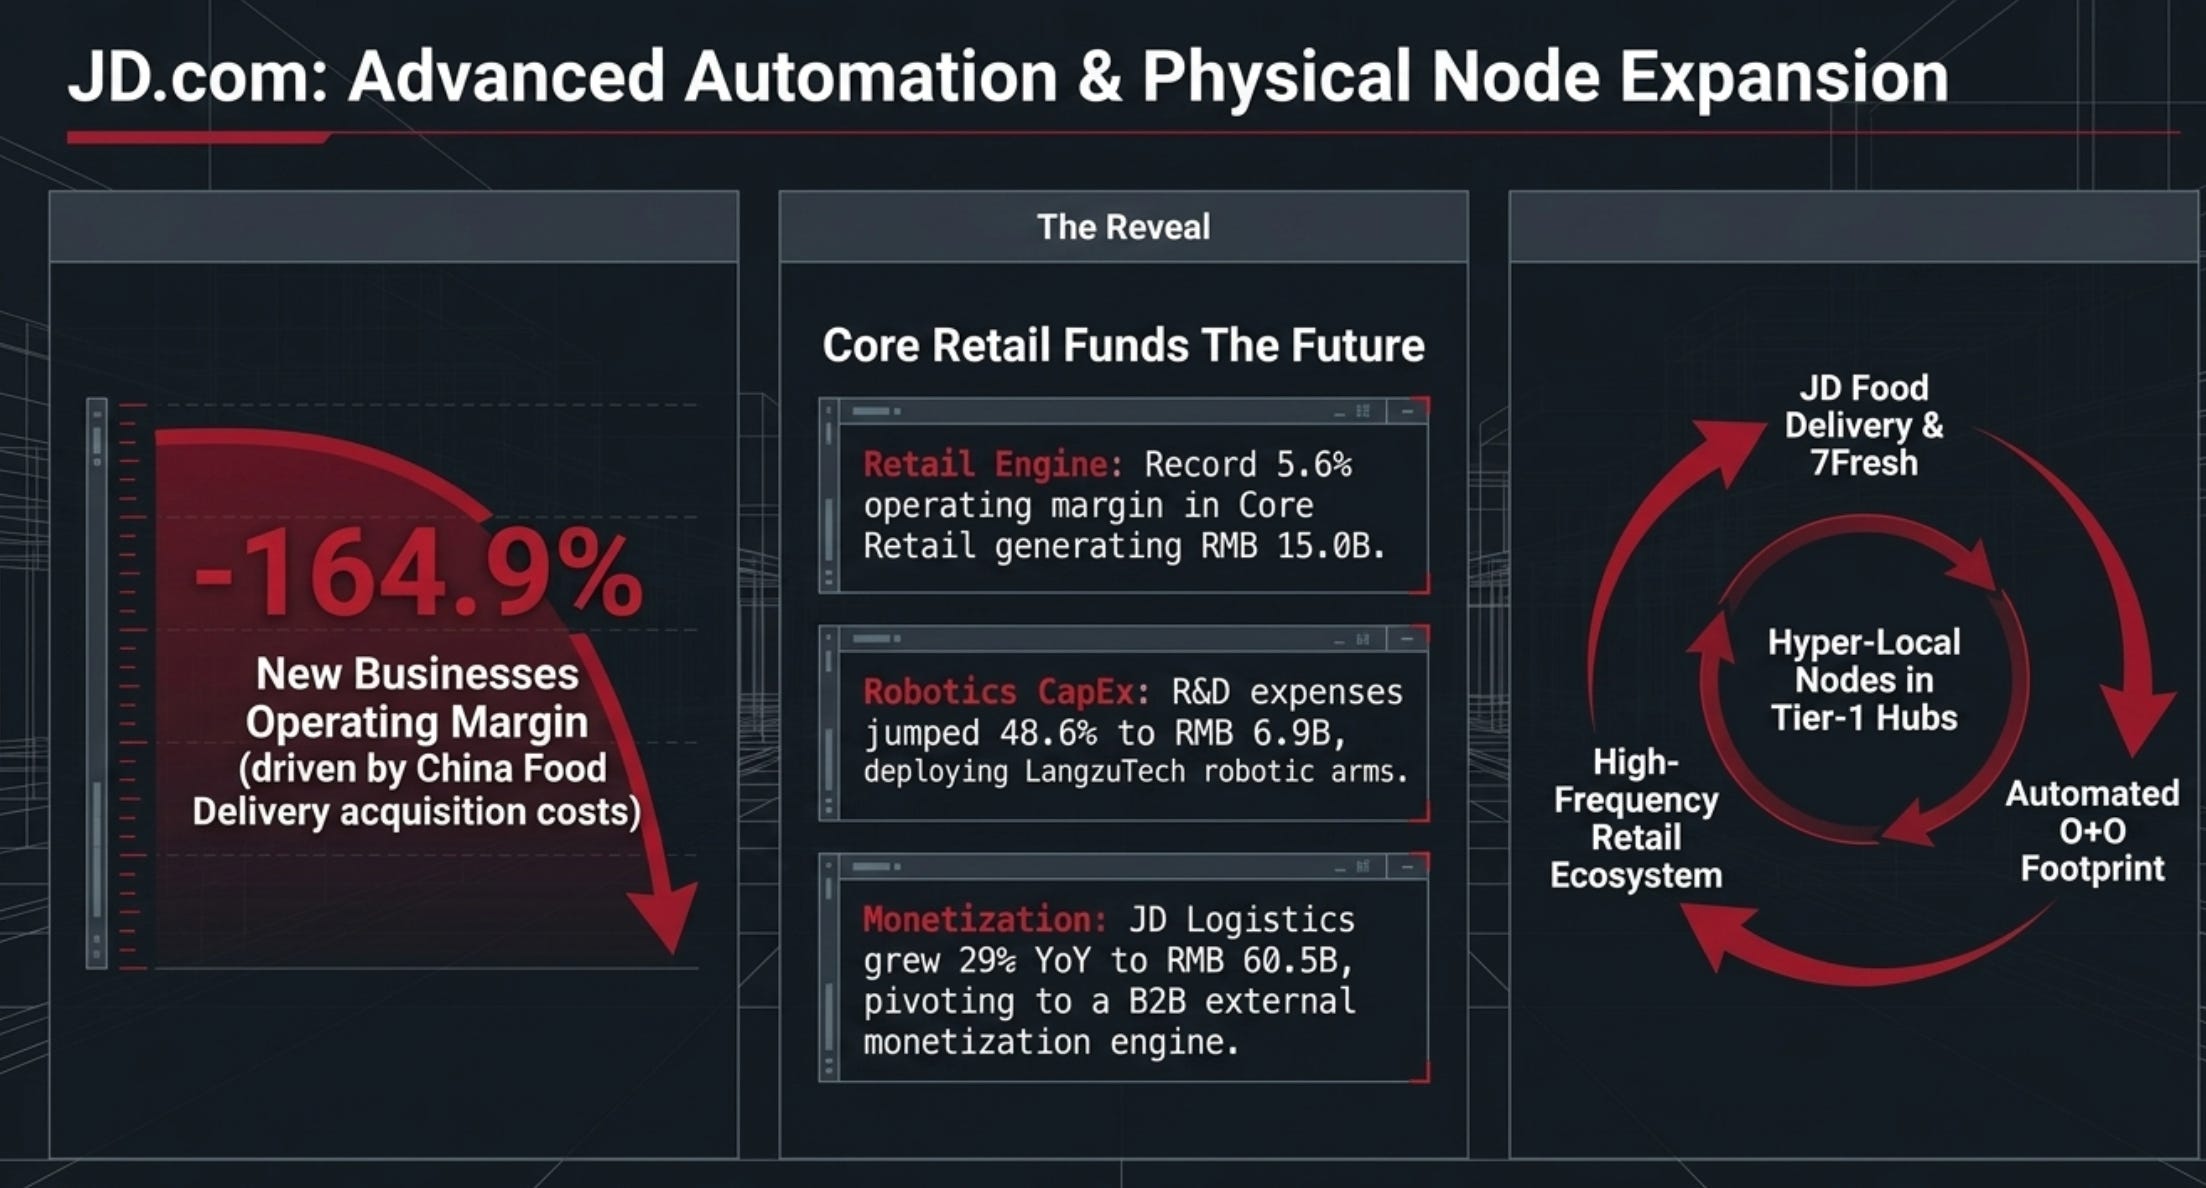
JD.com’s Core Resiliency: JD continues to show massive top-line numbers (RMB 315.7 billion), anchored by a record 5.6% operating margin in its core JD Retail segment. Profits from retail are actively funding its wider logistics ecosystem and food delivery cash burn.
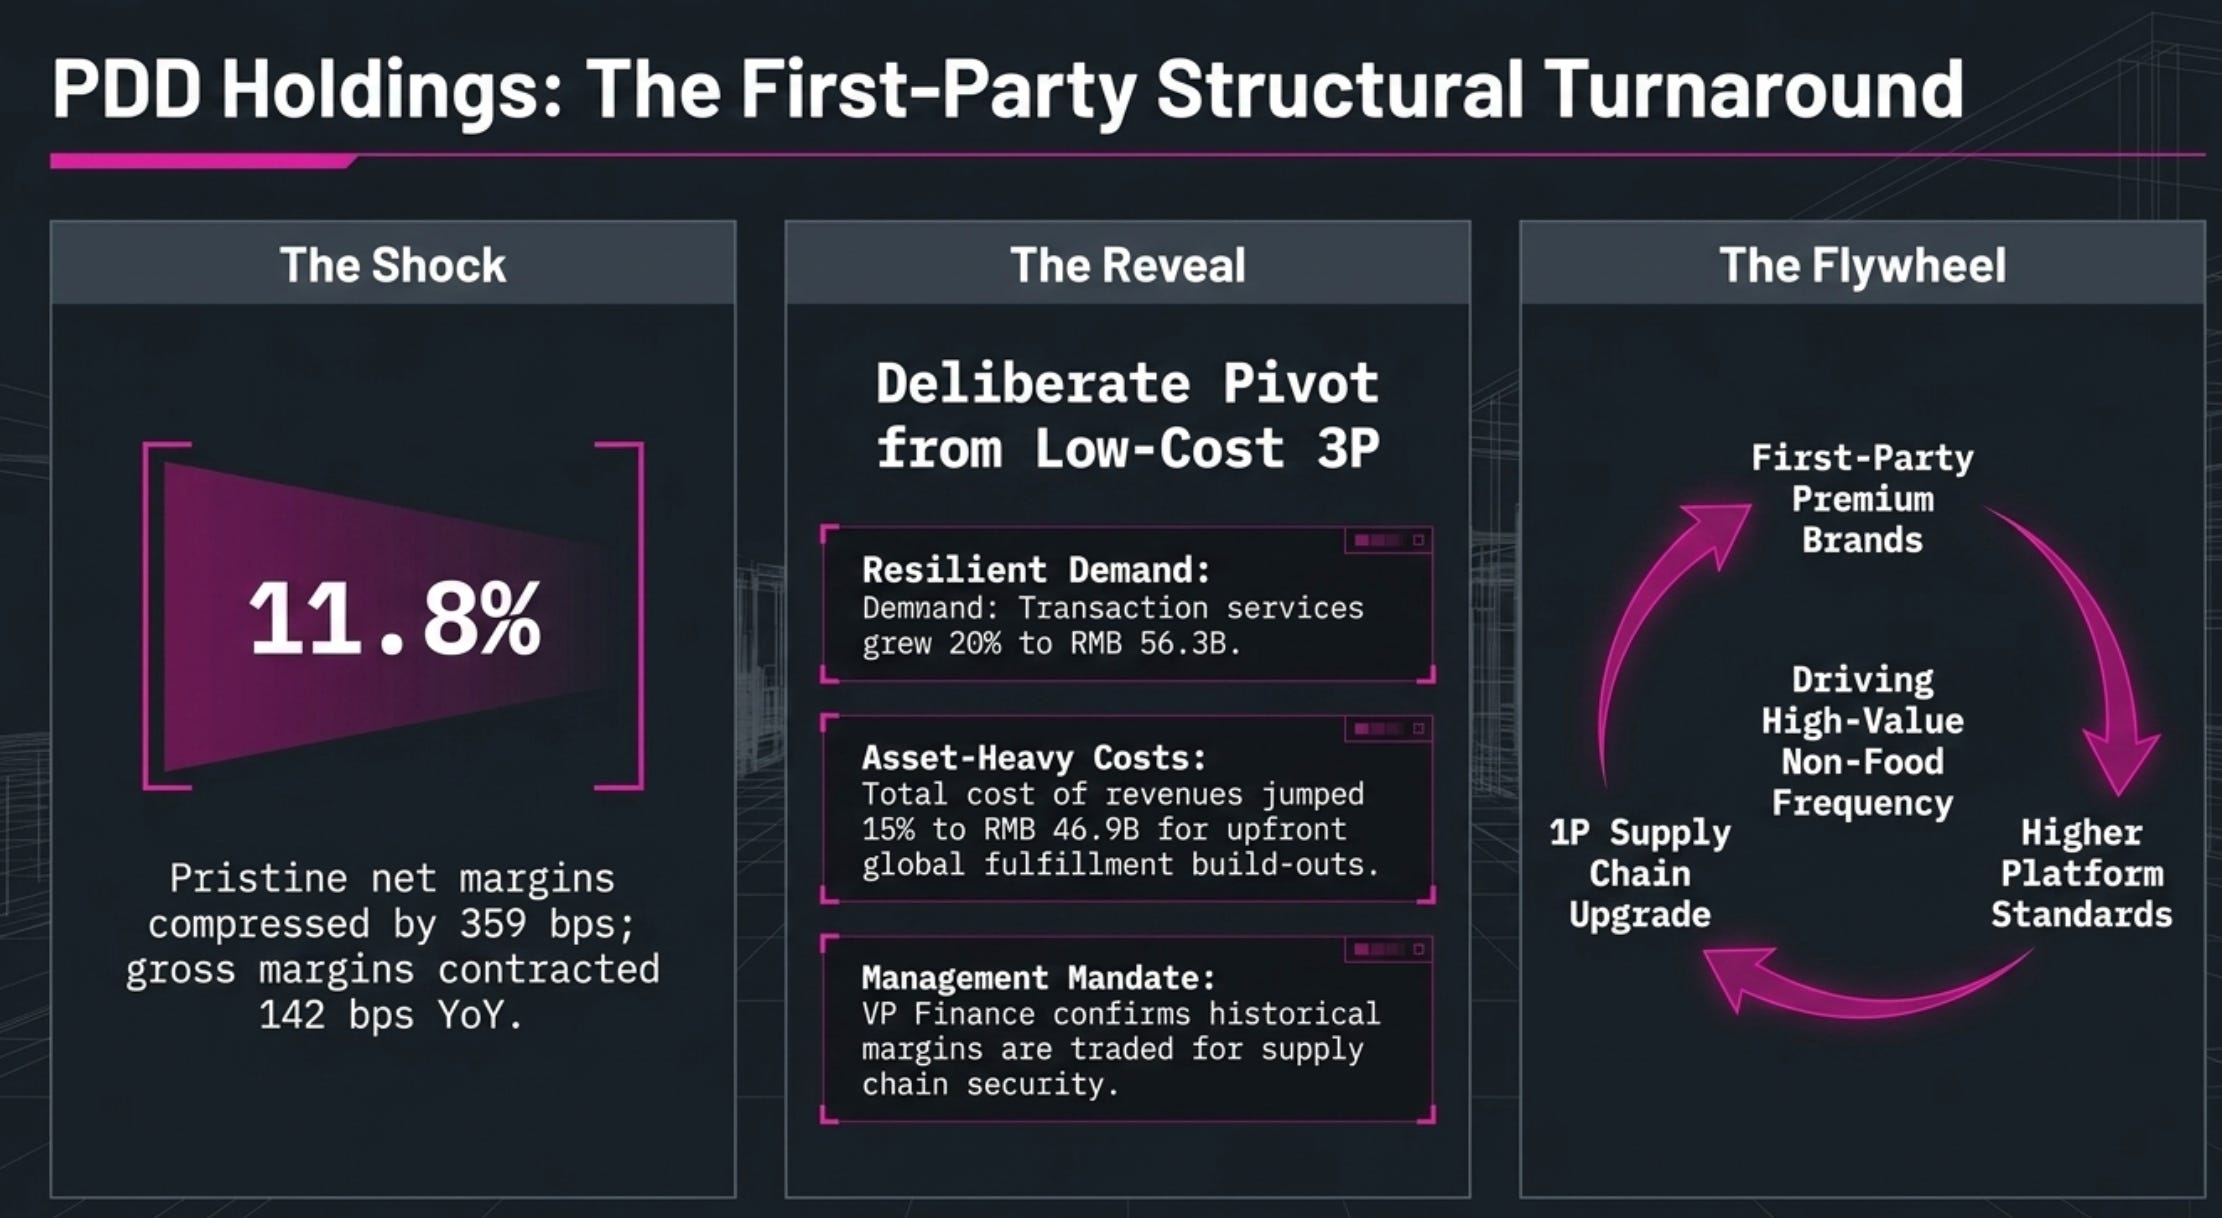
PDD’s Structural Pivot: PDD continues to grow robustly at 11%, but its pristine net margin compressed by 359 basis points to 11.8%. Upfront fulfillment costs and first-party supply chain investments outpaced top-line expansion for the first time.
2. Strategic Pivot: Next-Gen Quick Commerce & Online + Offline Integration
The major battleground in CY2026 is the “sub-hour delivery promise” for categories stretching far beyond restaurant food—including fast-moving consumer goods (FMCG), apparel, and consumer electronics.
[Alibaba Flywheel] ──> Taobao Instant Commerce ──> Inventory Dominance
[JD.com Flywheel] ──> JD Food Delivery & 7Fresh ──> Logistics/O+O Footprint
[PDD Flywheel] ──> Supply Chain Upgrade ──> First-Party Premium Brands
2.1 Alibaba: Ecosystem Unification under “Taobao Instant Commerce”
Alibaba has completed a massive re-centering, integrating its food-delivery app, Ele.me, directly into the flagship Taobao ecosystem.
The Blueprint: Dubbed “Taobao Flash Sales,” the strategy utilizes Taobao’s massive daily active user (DAU) base to capture immediate-need consumer intent. Segment revenue for this newly integrated Quick Commerce arm surged 57% YoY to RMB 19.9 billion.
Analyst Commentary: Alibaba is scaling from Online Retail Downward to Local Delivery. Its core advantage is an unmatched merchant inventory. By layering its proprietary Qianwen AI model across the platform, it is optimizing order matching and discovery, using its cash fortress to subsidize a massive multi-billion-dollar price war to squeeze local-services incumbents.
2.2 JD.com: Local On-Demand Food Delivery & 7Fresh Physical Expansion
JD.com has aggressively optimized its structural classifications to support an Online + Offline instant economy.
The Blueprint: Following the internal reclassification of its demand-delivery units, JD Logistics is now integrated alongside crowdsourced delivery drivers to serve third-party merchants directly. This infrastructure powers JD Food Delivery. Concurrently, JD is expanding its brick-and-mortar 7Fresh Kitchen footprint into Tier-1 hubs (Beijing, Shanghai, Shenzhen, Guangzhou, Tianjin) to act as hyper-local fulfillment nodes.
Analyst Commentary: Operating margins for JD’s New Businesses came in at -164.9%, hit explicitly by aggressive customer acquisition costs in the China Food Delivery space. However, this is a long-term user-frequency flywheel. By utilizing its automated logistics stack (LangzuTech Robotics, where R&D rose 48.6%), JD aims to achieve local unit economic breakeven through unparalleled automated sorting and cross-category retail purchasing.
2.3 PDD Holdings: The Supply Chain Turnaround & Brand Re-Upscaling
PDD has historically been the low-cost, third-party marketplace champion. In CY2026, management declared a formal pivot away from this niche.
The Blueprint: Through a multi-year transformation, PDD is reallocating capital into a first-party brand business and upgrading platform standards to drive higher order frequency in high-value, non-food, and premium categories. Supply chain investments are now the platform’s core strategic priority.
Analyst Commentary: PDD is addressing its structural weakness: a historical lack of high-margin brand equity. Transaction services grew 20% to RMB 56.3 billion, proving that consumer purchasing frequency remains bulletproof. However, building a first-party inventory and warehouse ecosystem is intensely capital-heavy. The compression of PDD’s gross margin to 55.8% reflects this painful transition.
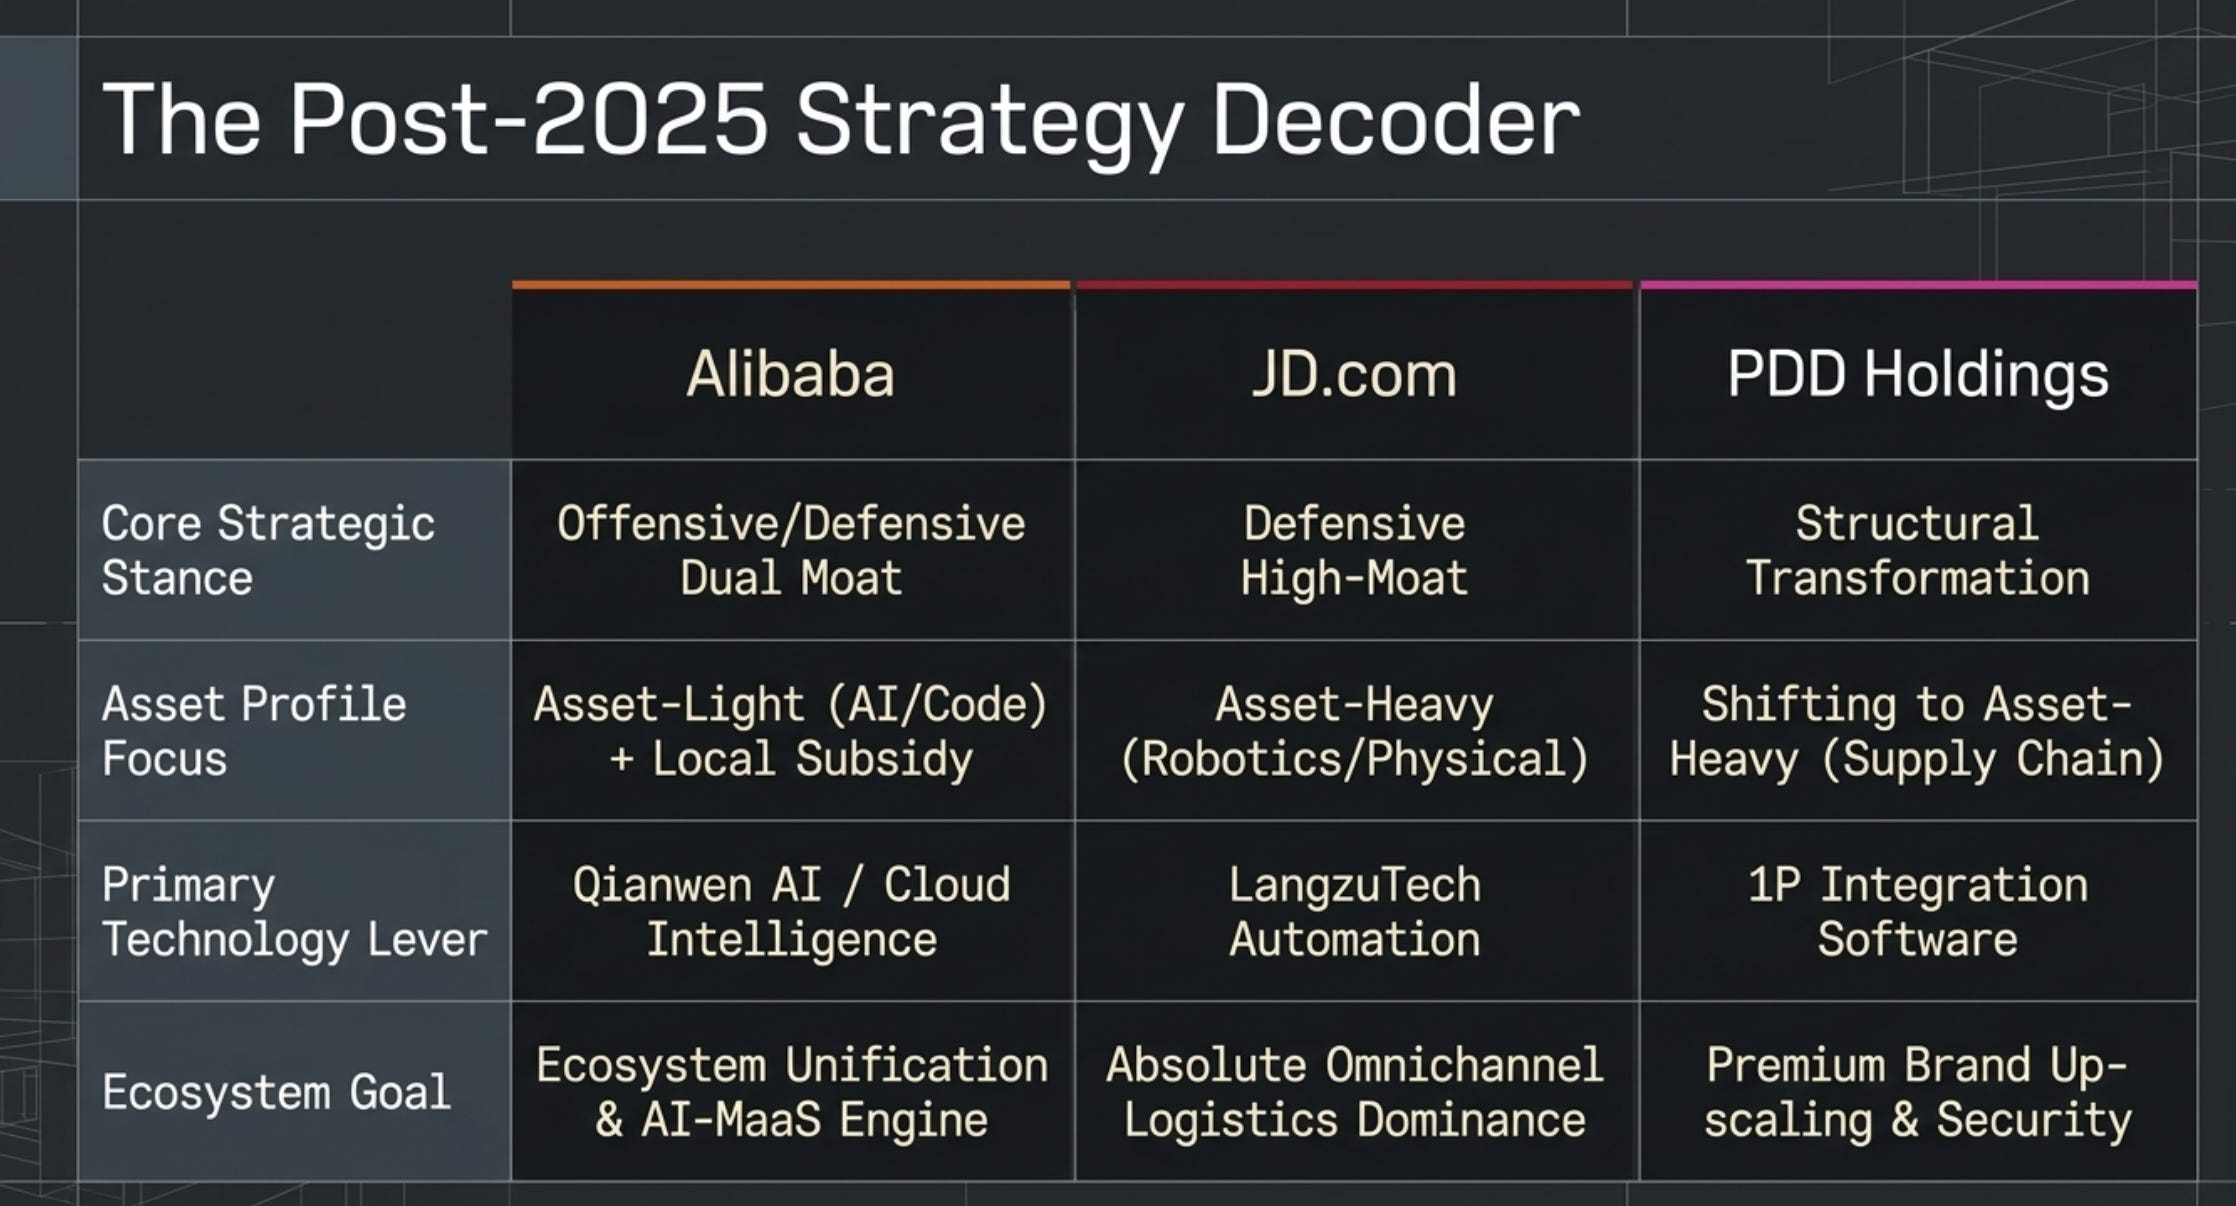
3. Reinvestment Competitive Landscape Analysis (Post-2025 Era)
Since 2025, the e-commerce industry has officially abandoned “peak margin retention” in favor of aggressive operational and structural reinvestment. The landscape can be synthesized into three distinct capital allocation strategies:
I. Operational Subsidy & AI CapEx (Alibaba’s Strategy)
Alibaba is utilizing its financial muscle to fund two defensive/offensive moats simultaneously:
The Cash Allocation: Alibaba spent an enormous RMB 17.7 billion in a single quarter under its “All Others” segment (powering Freshippo, Cainiao, and local services) alongside massive user-acquisition costs for the standalone Qwen AI App.
Ecosystem Imperative: They are willing to print near-zero near-term EBITA margins in exchange for driving 88VIP memberships (now scaling past 62 million) and locking in absolute tech sovereignty via public cloud dominance (Cloud Intelligence EBITA rose 57%).
II. Advanced Automation & Omnichannel Logistics Infrastructure (JD.com’s Strategy)
JD’s reinvestment is highly physical and technology-dense:
The Cash Allocation: R&D expenses jumped 48.6% YoY to RMB 6.9 billion. Capital was directed heavily into proprietary robotics software, specifically deploying the LangzuTech Packer robotic arms and JINGDONG Logistics Metabrain across the entire fulfillment chain.
Ecosystem Imperative: JD is leveraging its logistics efficiency to capture higher third-party merchant mix. JD Logistics grew an impressive 29% YoY to RMB 60.5 billion, shifting successfully from an internal cost center to a high-yield external B2B monetization engine.
III. Fulfillment & First-Party Structural Build-out (PDD’s Strategy)
PDD is facing the realities of scaling globally and upmarket domestically:
The Cash Allocation: Total cost of revenues jumped 15% to RMB 46.9 billion, directly feeding payment processing fees, server/bandwidth scaling, and upfront global fulfillment asset build-outs.
Ecosystem Imperative: PDD’s corporate tone, led by VP of Finance Ms. Jun Liu, confirms that historical margin peaks are being explicitly traded to guarantee ecosystem security and first-party supply chain integration. Volatility will persist as PDD transitions from an asset-light middleman to an asset-heavy supply-chain partner.
Strategic Summary for Institutional Investors
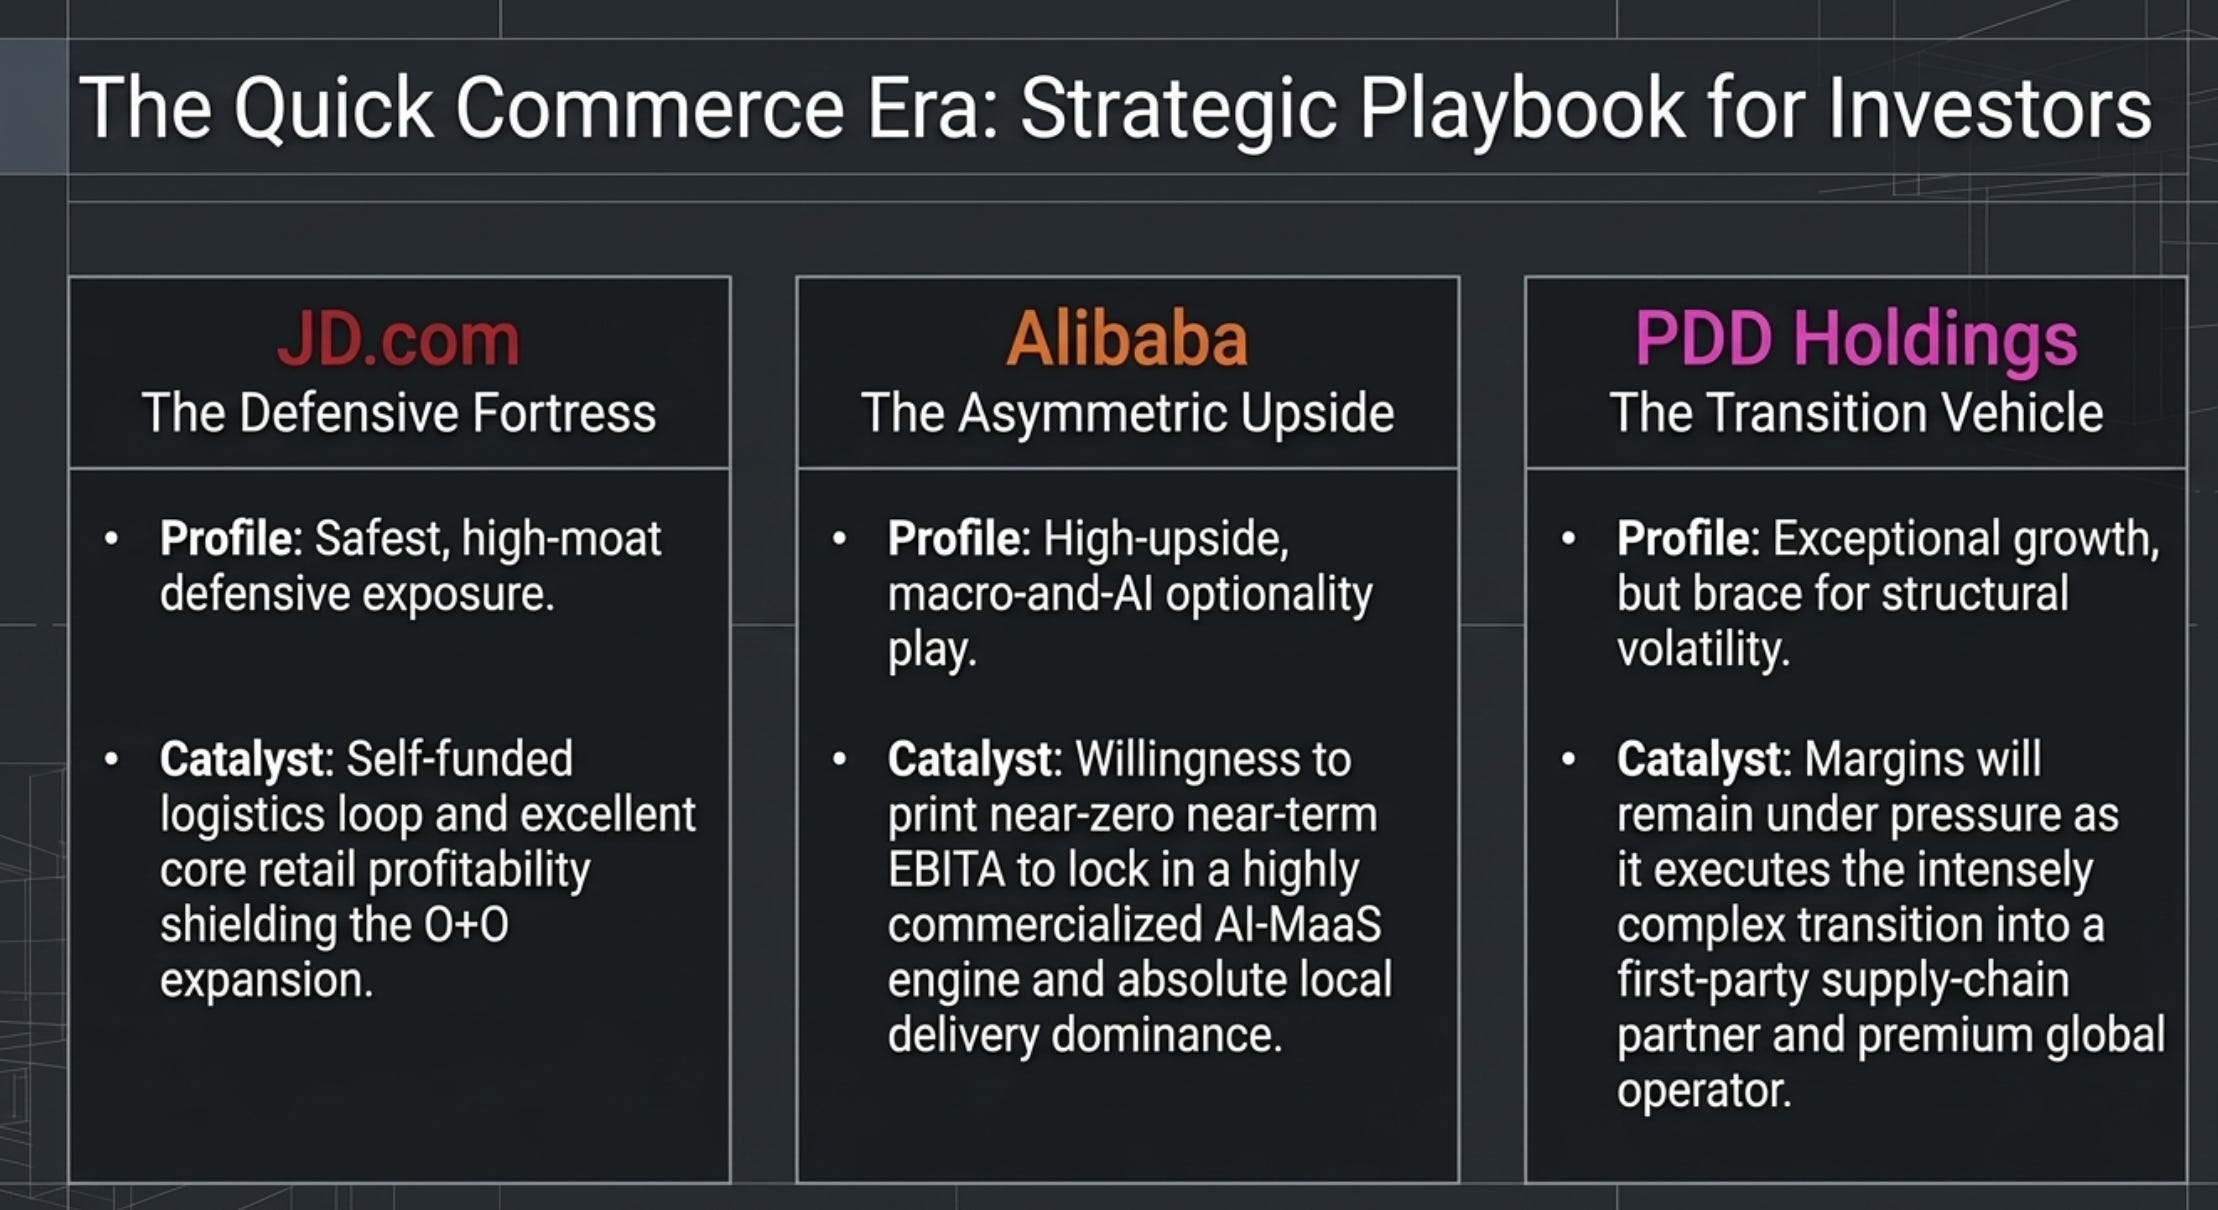
The Chinese e-commerce sector is healthier from a consumer engagement perspective than the consensus fears—but it is fundamentally more expensive to operate in. JD.com offers the safest, high-moat defensive exposure due to its self-funded logistics loop and excellent core retail profitability. Alibaba represents a high-upside, macro-and-AI optionality play, sacrificing short-term retail profits to build a highly commercialized AI-MaaS engine and an on-demand delivery network. PDD Holdings remains an exceptional growth vehicle, but investors must brace for compressed margins as it enters the complex world of asset-heavy first-party fulfillment and premium supply chain creation.
Disclaimer: This document presents proprietary industry research and analysis. The projections and conclusions contained herein are for informational purposes only and should not be construed as investment recommendations or financial advice in any form. We aim to provide factual information combined with our independent analysis to enhance the reader’s understanding of the technology industry.